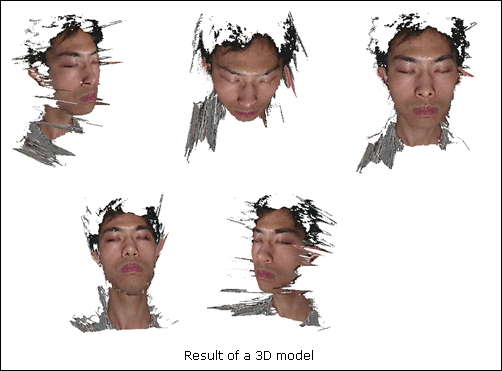
Evaluation has been conducted with a 3D mega capturer as golden standard. Our scanner uses an image resolution of 1280 x 1024 during the evaluation. Seven human subjects were sampled using my 3D scanner and the 3D mega capturer within one hour to ensure sample consistency. Since our goal is to apply this 3D scanning technology on mask fitting, the comparison should be made on the facial anthropometries. The following shows the root-mean-square (RMS) error found in our 3D model compared with that of the mega one:
| Facial features | Root- Mean-Square Error (cm) | Minimum Error (cm) | Maximum Error (cm) |
|---|
| 1 Menton-to-Nasal | 0.38 | 0.05 | 0.85 |
| 2 Menton-to-Subnasal | 0.32 | 0.06 | 0.57 |
| 3 SubNasal-to-NasalRoot | 0.46 | 0.06 | 0.77 |
| 4 Nose Width | 0.02 | 0 | 0.06 |
| 5 Lip Length | 0.23 | 0.01 | 0.39 |
| 6 Nose Protrusion | 0.00 | 0 | 0.01 |
| Average Error | 0.24 | 0.03 | 0.44 |
The worst performing feature was SubNasal2NasalRoot with RMS of 4.6 mm while an average RMS of 2.4 mm resulted. The minimum and maximum error were also compared which reveals most errors were contributed by one or two particularly poor measurements. The anthropometry comparison of each human subject in details is shown below:
| Features | Subject #1 | Subject #2 | Subject #3 | Subject #4 | Subject #5 | Subject #6 | Subject #7 |
|---|
| | Proto Gold | Proto Gold | Proto Gold | Proto Gold | Proto Gold | Proto Gold | Proto Gold |
| 1 | 12.4 12.45 | 11.34 11.26 | 12.48 13.33 | 13.08 12.79 | 11.34 10.9 | 12.50 12.59 | 12.42 12.36 |
| 2 | 7.00 7.07 | 6.62 6.68 | 7.13 7.70 | 7.48 7.39 | 7.04 6.95 | 6.94 7.50 | 7.46 7.28 |
| 3 | 5.47 5.53 | 4.99 4.85 | 5.38 5.79 | 6.29 5.78 | 4.55 4.20 | 6.22 5.45 | 5.78 5.21 |
| 4 | 4.17 4.11 | 4.74 4.74 | 3.77 3.76 | 3.93 3.93 | 3.84 3.84 | 4.07 4.07 | 4.34 4.34 |
| 5 | 5.81 5.80 | 5.51 5.62 | 5.20 5.28 | 5.18 5.57 | 5.05 4.67 | 4.24 4.50 | 5.73 5.68 |
| 6 | 1.55 1.54 | 1.57 1.57 | 1.90 1.90 | 1.60 1.60 | 1.59 1.59 | 1.95 1.95 | 2.09 2.09 |
The worst performing feature was SubNasal2NasalRoot with RMS of 4.6 mm while an average RMS of 2.4 mm resulted. The minimum and maximum error were also compared which reveals most errors were contributed by one or two particularly poor measurements.
Evaluation has been conducted using a 3D mega capturer as golden standard. Six anthropometries of seven human subjects has been sampled and extracted by my scanner and the mega one for comparison. The scanning process is taken within one hour to reduce inconsistency. Result shows a maximum RMS error of 4.6 mm while an average RMS error of 2.4 mm. This section aims to account for the error and possible solutions.
The result of my scanner is not surprising since no accurate calibration of both camera and projector have been performed. As mentioned in section 4.2.1, the lens distortion error is only roughly solved by using a zoom in method. Although the zoom in scale of this evaluation has been increased into 240%, lens distortion still exists.
Actually, there were visible head movements found in the image sequences. It may be due to the relatively long scanning process. After all, human are movable objects, involuntary head movement due to body balancing or others reasons are reasonable.
The minimum and maximum error were compared which reveals most errors were contributed by one or two particularly poor measurements. The error possibily stem from the lens distortion, but other factors such as the manual extraction of anthropometries may also contribute to it. While the anthropometry of the 3D mega capturer part is extracted by a student helper, anthropometry of my scanner is extracted by me which may cause inconsistency.
The extraction error can be solved by using the same person on anthropometry extraction while solutions of the moving subject error have been discussed in previous chapters (the projector-camera synchronization), I am not going to talk about it here. More will be talk on the lens distortion error since it is possibly the main contribution of error.
Usually, lens distortion of cameras and projectors will result in significant measurement errors. To allow highly accurate measurements, calibration of both camera and projector is needed.
For camera calibration, the factorized approach originally proposed by Zhang (Zhang, 2000) can be adopted. It involves photo capturing of a known sized checkerboard in two or more orientations. The photos are then analyzed by a calibration program which yields a calibration matrix. Photo editing can be performed using the matrix as long as the intrinsic parameters remain unchanged.
For projector calibration, the novel approach of Douglas (Douglas and Gabriel, 2009) can be adopted. It is in fact a modification of the factorized approach of Zhang. It involves projecting a checker board image onto a calibration whiteboard with four printed checkerboard corners. Again, two or more orientations of views are recorded and analyzed.


